YouTube growth, without the noise.
Tactics, channel deep-dives, and creator playbooks from the team behind YTGrowth. Written by humans, tested on real channels.
 Analytics
YouTube Traffic Sources Explained: What's Normal, and What to Fix First
YouTube names 17 traffic-source categories in Studio and explains none of them. Here is what each one means, the real Browse Features vs. Suggested Videos click-through gap (10-12% vs 0.6%), and what a normal Direct or Unknown percentage looks like.
More from the blog
 Monetization
YouTube Super Thanks Payout Math, Including the Apple Fee Nobody Mentions
A $199 Super Thanks paid out $98, less than half. The gap is Apple's own 30% in-app purchase fee, charged on top of YouTube's cut when a viewer pays on iOS, verified against Apple's own developer terms.
 Monetization
Are YouTube Channel Memberships Worth It? A Payout Math Breakdown
YouTube takes 30% of channel membership revenue, and typical conversion runs 0.5% to 3% of subscribers. Here is the real payout math at three channel sizes, so "worth it" is a number, not a guess.
 Analytics
What Is a Good YouTube Engagement Rate? Our Findings from a 49,802-Video Study
Engagement rate benchmarks usually give one number. We measured (likes + comments) / views across 49,802 tracked videos, split by niche, by format, and by subscriber count, and found long-form beats Shorts in every niche, the opposite of what a widely cited competitor study claims.
 Analytics
How Long Does It Take for a YouTube Video to Get Views? A Study of 18,423 Tracked Videos
Every generic guide describes a video's view timeline from memory, a boost, a dip, a slow climb over months. We measured it directly across 18,423 tracked videos. 94.5% of a video's 30-day view total arrives within the first week.
 Monetization
How to Make Money on YouTube Beyond Ads
YouTube pays creators 70% of both channel memberships and Super Thanks after fees, sourced directly from YouTube's own policy pages, not a vendor's guess. Every real method beyond ad revenue, ranked by what it pays and what it takes to start, plus what to prioritize at your channel's size.
 Analytics
YouTube Data Studies: Every Study We've Published So Far
Every original YouTube data study we've published, all measured from our own tracked-channel data, not a survey or a guess. What's live, what's queued next, and how the data behind each one is collected.
 Analytics
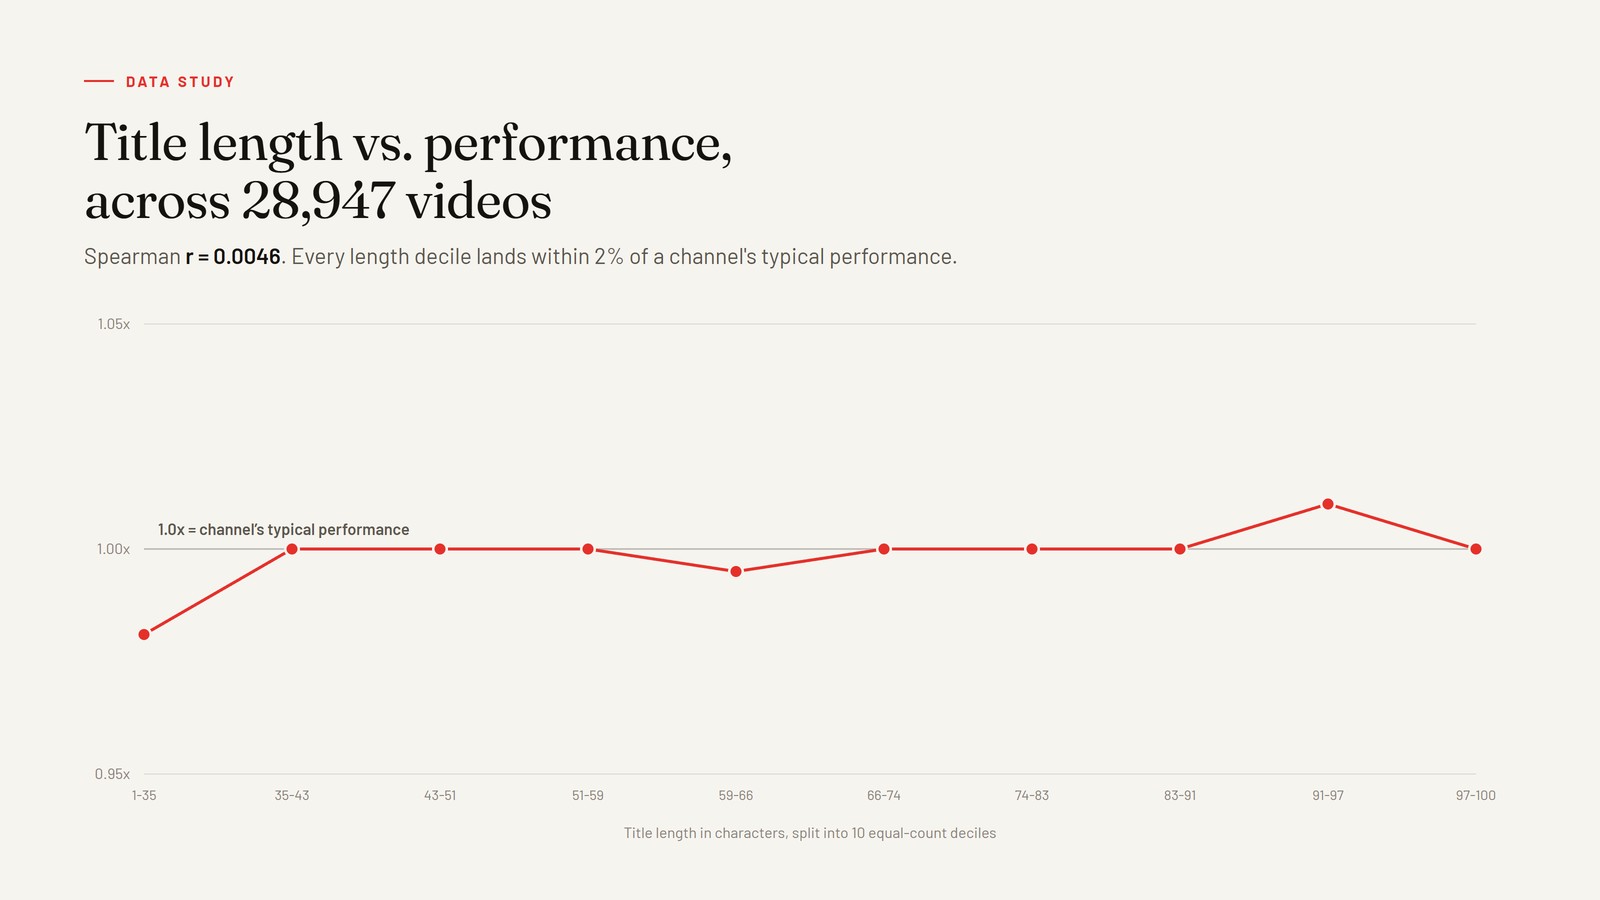
YouTube Title Length Doesn’t Predict Performance: A 28,947-Video Study
Four published studies each recommend a different YouTube title length, and none of them agree. We measured it directly across 28,947 tracked videos and 707 channels, normalized for channel size and video age, and title length explains almost none of the variance in performance. The actual curve, the one pattern that might matter, and where the four studies went wrong.
 Strategy
YouTube Video Ideas: 111 Ideas in 15 Formats, Measured Against 83,423 Uploads Across 14 Niches
Most video ideas lists dump every niche into one scrolling wall with no way to tell which ten ideas apply to your channel. This one sorts by format first, backed by real upload data across 14 niches, so the reader can find their format and the length, cadence, and Shorts mix that already works for it.
 Strategy
Music Video Ideas: Formats That Promote the Song, and Formats That Build the Channel
Most musician content guides mix song promotion and channel-building into one undifferentiated list. This one splits them, 43 ideas across seven formats, measured against 6,801 music uploads: 2.8 minute median length, the shortest of any tracked niche, and 37% Shorts share, the second-highest.
 Strategy
Tech Video Ideas: What to Film Between Launches
Reviewing whatever device just launched is the obvious tech video, and also the one a bigger channel with more subscribers already owns. 33 ideas grouped into six formats built to survive between launches, measured against 5,876 tech uploads since January 2025 for length, format mix, and how much of the niche already runs on Shorts.
 Strategy
Cooking Video Ideas: What to Film When Recipes Run Out
Recipes are the easy part of a cooking channel; running out of ones worth filming is what stalls it. 34 ideas grouped into six formats that outlast any single recipe, measured against 3,859 cooking uploads since January 2026 for what gets filmed, how long it runs, and where a Shorts strategy fits.
 Strategy
Comedy Video Ideas: 42 for People Who Are Not Naturally Funny
Comedy is one of the few YouTube niches where search demand barely exists, so the premise has to win the click before anyone has laughed. 42 ideas grouped by the six mechanisms behind every comedy premise, plus real upload data on what comedy channels publish and the copyright and prank-policy traps that end them.