
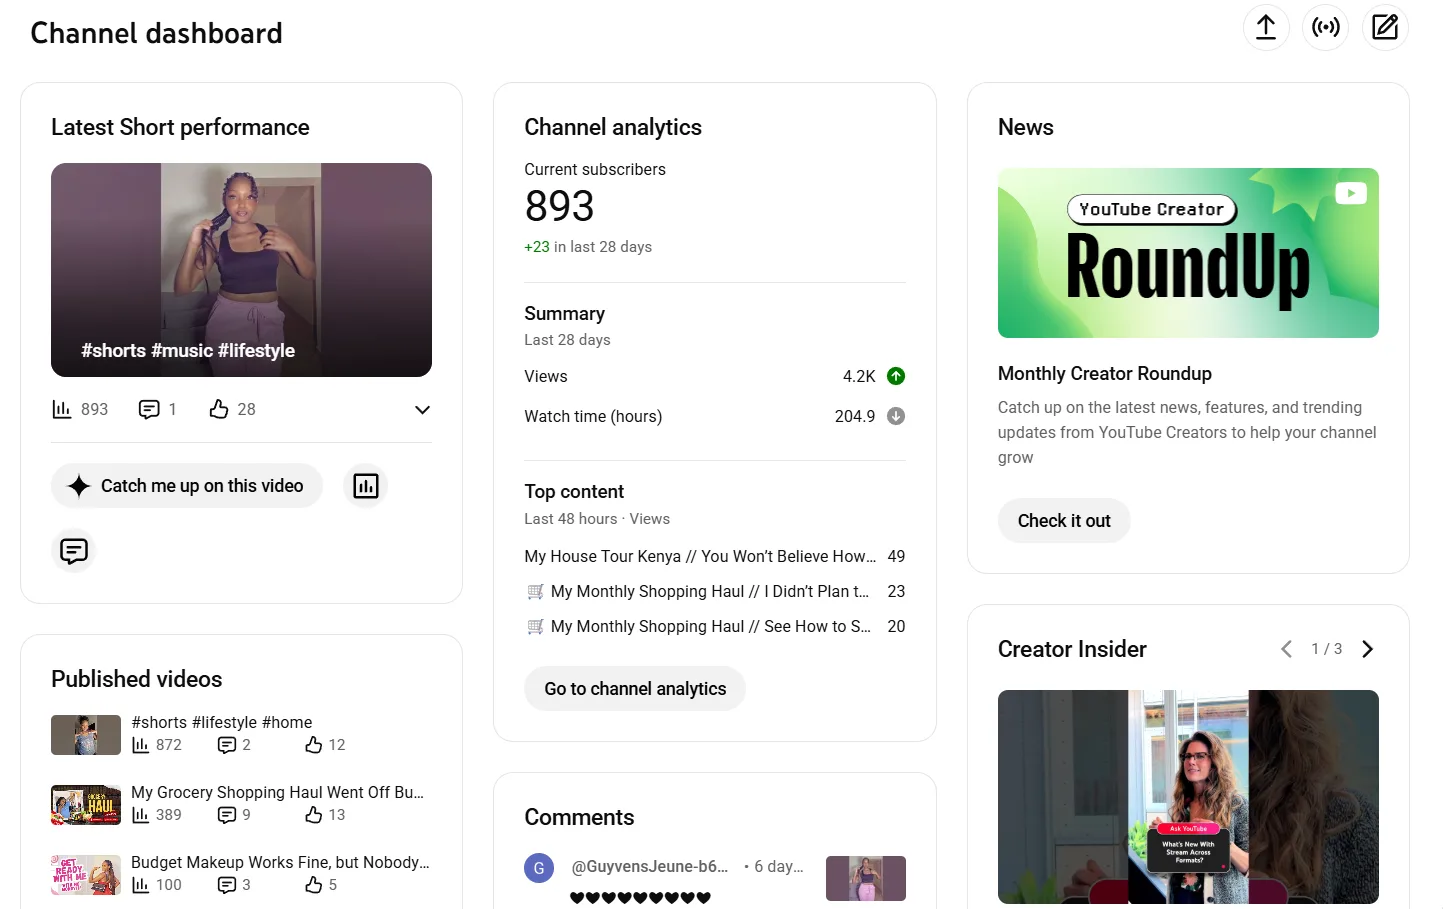
YouTube gives every creator access to a full performance dashboard the moment they upload a video. Most creators open it, check their view count, and close it without acting on anything else.
Views are one of the least actionable metrics in YouTube analytics. They tell you what happened but not why. CTR tells you whether your packaging is working. Retention tells you whether your content is holding attention. Traffic sources tell you how viewers are finding you. Those three metrics tell you what to fix. Views just tell you the score.
This guide breaks down every tab in YouTube Studio, explains every YouTube metric that matters, and gives you a post-publish routine that turns data into specific decisions before your next upload.
What Is YouTube Analytics and How to Access It
YouTube analytics is YouTube's built-in performance dashboard that tracks every aspect of your channel and video performance in real time. It covers views, watch time, click-through rate, audience demographics, traffic sources, and revenue data across your entire channel and individual videos.
How to access it on desktop:
- Go to studio.youtube.com and sign in.
- Click Analytics in the left navigation menu.
- Select Channel Analytics for overall performance or click into any individual video to view its specific data.
How to access it on mobile:
- Open the YouTube Studio app.
- Tap the Analytics icon in the bottom navigation bar.
- Swipe between tabs to view channel or video-level data.
How often does the data update:
| Data Type | Update Frequency |
|---|---|
| Real-time views | Last 48 hours, updates continuously |
| Most metrics | Every 24 to 48 hours |
| Revenue data | 24 to 48 hours with a 3-day delay |
| Audience demographics | Every 24 to 48 hours |
YouTube Studio organizes all data across five tabs. Each tab covers a distinct dimension of your channel's performance and answers a different question about your growth.
- Overview: How is my channel performing overall?
- Content: How is my audience finding and interacting with my content?
- Audience: Who is watching and when?
- Revenue: How much is my content earning?
- Trends: What is my audience watching beyond my own content?
Each tab is covered in detail in the sections that follow.
1. The Overview Tab
The Overview tab is the first screen you see when you open YouTube studio analytics. It gives you a high-level summary of your channel's performance across a selected time period without requiring you to dig into individual metrics.
What the Overview tab shows:
- Views: Total number of times your videos were watched in the selected period
- Watch time: Total hours viewers spent watching your content
- Subscribers: Net change in subscriber count, gains minus losses
- Estimated revenue: Total ad revenue for monetized channels
- Real-time activity: Views and impressions from the last 48 hours updated continuously
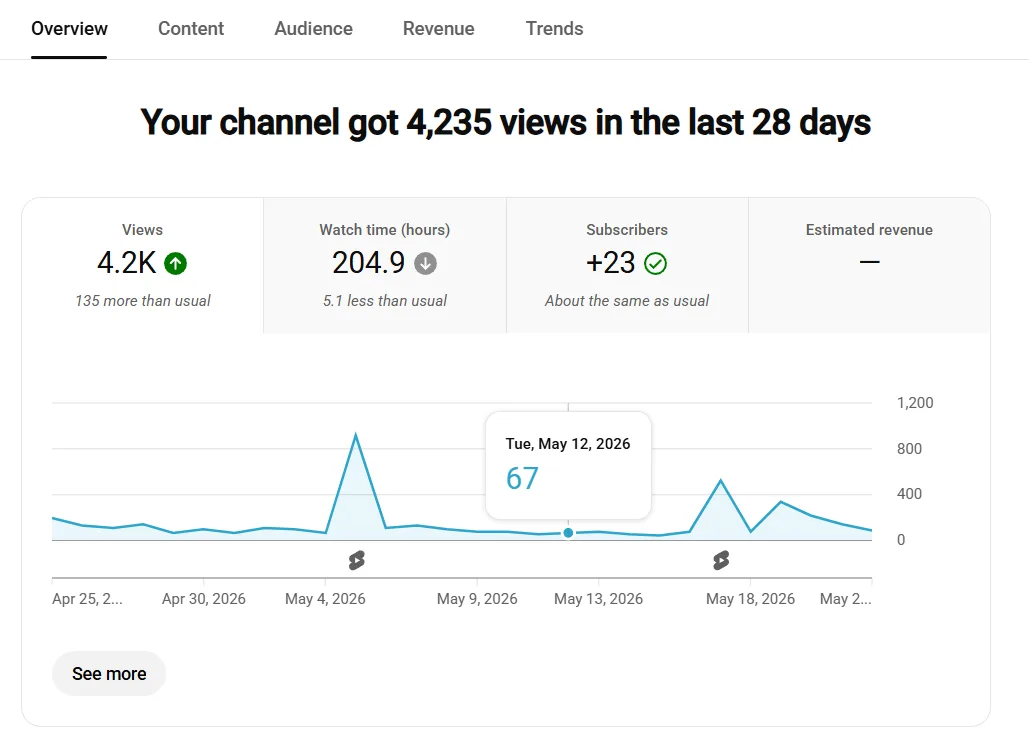
How to Read the Performance Graph
The main graph plots your selected metric over time. Use the dropdown above the graph to switch between views, watch time, subscribers, and revenue. Look for three patterns:
- A consistent upward trend signals healthy compounding growth
- A sudden spike followed by a drop signals a viral moment with no sustained momentum behind it
- A gradual decline signals a content, consistency, or algorithm issue worth investigating
Typical performance sits below the main graph as a grey band showing your historical average range. When a recent video performs above the band, the algorithm is amplifying it beyond your normal distribution. When it sits below, the video underperformed against your own baseline.
The Overview tab is useful for spotting patterns and anomalies. It is not where you find the data to act on. The Content tab holds the channel-level metrics that tell you what to change, and clicking into any individual video gives you access to its Reach and Engagement tabs for deeper diagnosis.
2. The Content Tab: Impressions, CTR, and Traffic Sources
The Content tab gives you a channel-level summary of how your audience finds and interacts with your videos across your entire library. It is where impressions, CTR, and traffic source data live at the channel level, not in a separate Reach tab.
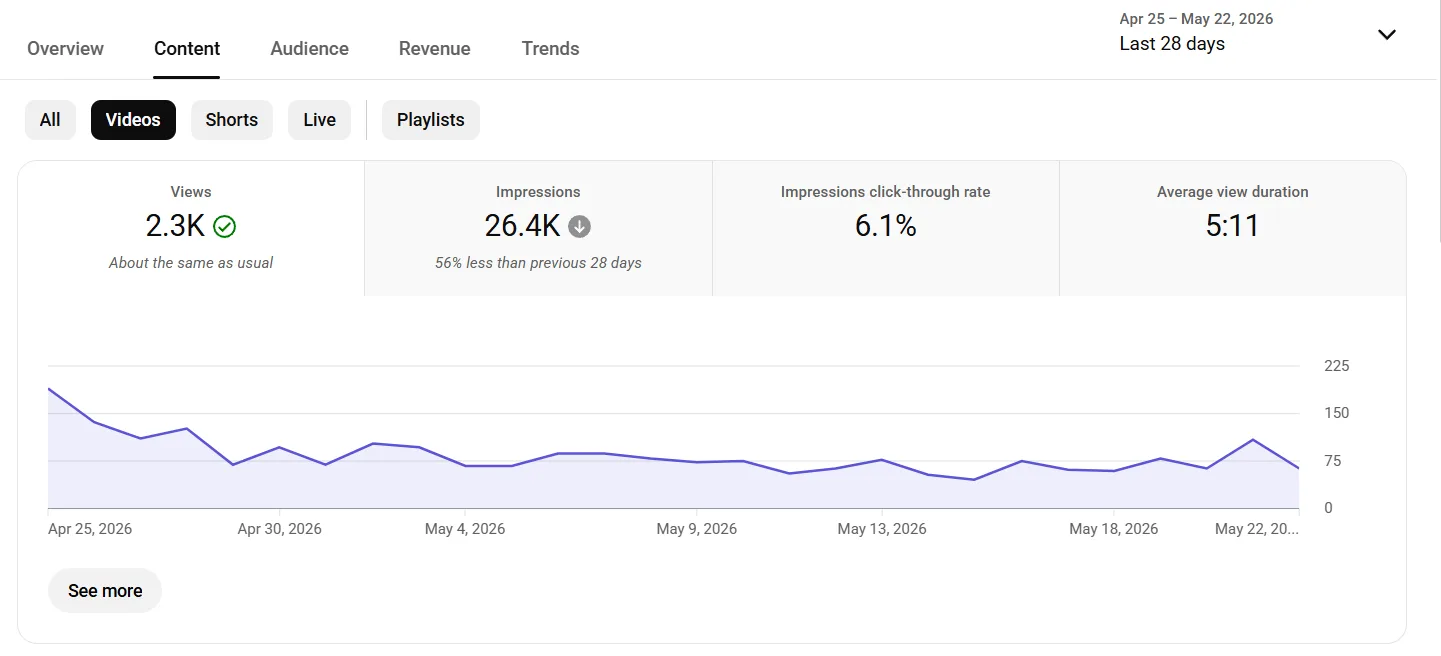
What the Content tab shows:
- Impressions: How many times YouTube showed your thumbnails to viewers across all videos
- Impressions CTR: What percentage of those impressions converted into views
- Watch time: Total hours viewers spent watching your content
- Top content: Your best performing videos sorted by views, watch time, or impressions
- Traffic sources: Where views are coming from across your entire channel
Impressions and CTR
Impressions count how many times YouTube showed your thumbnail to a viewer. A low impression count means the algorithm is not distributing your content widely. CTR measures what percentage of those impressions converted into views and is the most direct signal of whether your thumbnail and title combination is working.
| CTR Range | What It Means | Action |
|---|---|---|
| Below 2% | Packaging is significantly underperforming | Update thumbnail and title immediately |
| 2% to 4% | Below average, room for improvement | Test a new thumbnail on existing videos |
| 4% to 6% | Average performance | Monitor and refine title formula |
| 6% to 8% | Strong performance | Identify what is working and replicate it |
| Above 8% | Exceptional performance | Use this video as a packaging benchmark |
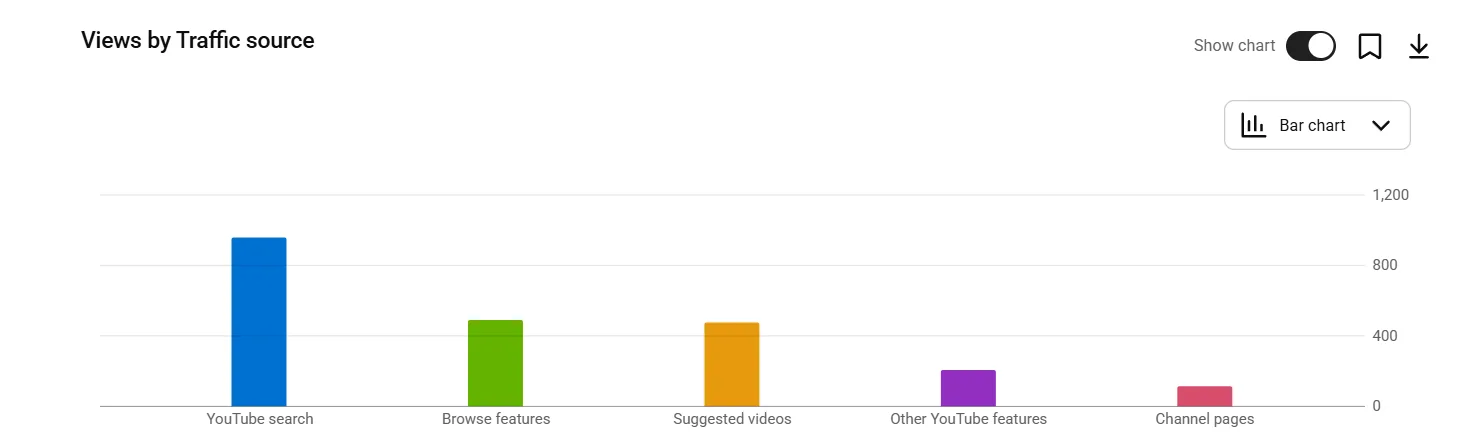
Traffic Sources
The traffic sources report breaks down where your views are coming from across your full channel. Click See More under the traffic sources card to expand the full breakdown and click into each source for detailed data.
| Traffic Source | What It Signals |
|---|---|
| YouTube Search | Strong keyword targeting and SEO |
| Browse Features | Algorithm amplification on homepage |
| Suggested Videos | Algorithm recommending alongside similar content |
| External | Promotion outside YouTube driving traffic |
| Playlists | Strong session time and content grouping |
| Notifications | High subscriber engagement quality |
YouTube Search Terms
Inside the YouTube Search traffic source sits one of the most underused tools in YouTube channel stats. Click on YouTube Search in your traffic sources and scroll down to see the exact phrases viewers typed before finding your videos.
These confirmed search queries are content opportunities with pre-validated demand. Any phrase driving consistent traffic that you have not yet built a dedicated video around is a gap worth filling.
Note: For video-level impressions and CTR data specific to one upload, click into any individual video from the Content tab and select the Reach tab within that video's analytics.
Pro Tip: In the Content tab, sort your videos by impressions and identify any video with high impressions but low CTR. These are your highest leverage optimization targets. A thumbnail update on a high-impression video can revive distribution without publishing anything new.
3. The Audience Tab: Who Is Watching
The Audience tab answers a question most creators overlook entirely: is the algorithm serving your content to the right people. High view counts with the wrong audience profile produce low subscriber rates, weak engagement, and content strategy decisions built on misleading data.
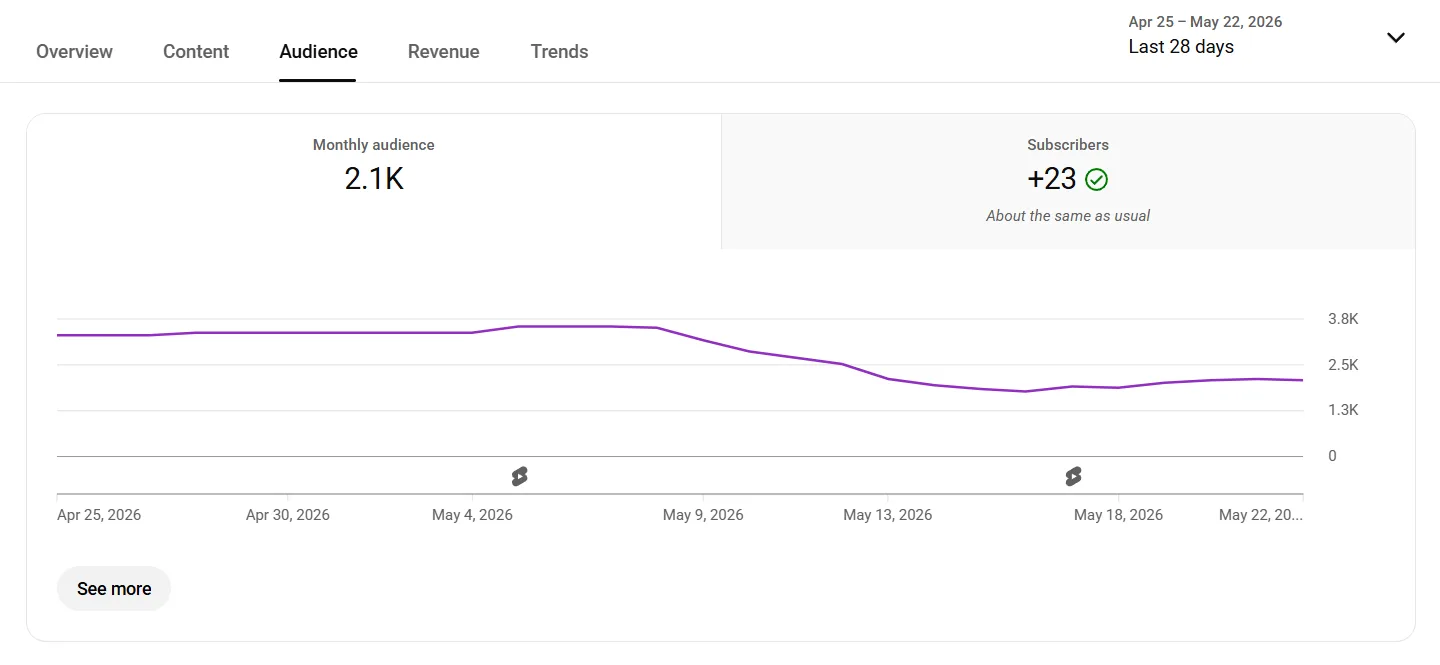
New vs Returning Viewers
This is the most important metric in the Audience tab for diagnosing growth plateau. A healthy growing channel pulls a consistent percentage of new viewers on every upload.
| Viewer Split | What It Signals | Action |
|---|---|---|
| Above 70% returning | Channel is not reaching new audiences | Add search-optimized content to attract new viewers |
| 50% to 70% returning | Balanced but leaning toward existing audience | Increase keyword-targeted content frequency |
| Below 50% returning | Strong new viewer acquisition | Focus on converting new viewers to subscribers |
Subscriber Demographics
The age, gender, and geographic breakdown of your subscribers tells you whether your content is reaching the audience it was designed for. A channel creating content for 25 to 34 year old professionals but attracting a majority of 13 to 17 year old viewers has a content-audience mismatch that affects every growth metric downstream.
Geography
The geographic breakdown shows where your viewers are located. This data has two direct applications. First, it explains CPM variation in your revenue data since viewers in the US, UK, and Australia generate significantly higher ad rates than viewers in other markets. Second, it tells you whether your content language, references, and context are resonating with your intended geographic audience.
When Your Viewers Are on YouTube
This graph shows the days and times your existing audience is most active on the platform. Publishing when your audience is most active increases the likelihood of early engagement during YouTube's test window, which strengthens the video's distribution signal in the critical first 48 hours.
Other Channels Your Audience Watches
This section shows which other YouTube channels your audience subscribes to. It is your most direct competitor list and one of the most underused insights in all of YouTube channel statistics. Every channel listed is a potential collaboration partner, a benchmark competitor, and a source of content gap research.
4. The Revenue Tab
The Revenue tab is only visible to channels that have been accepted into the YouTube Partner Program. It covers how much your content is earning, which revenue sources are contributing most, and which content types generate the highest ad income.
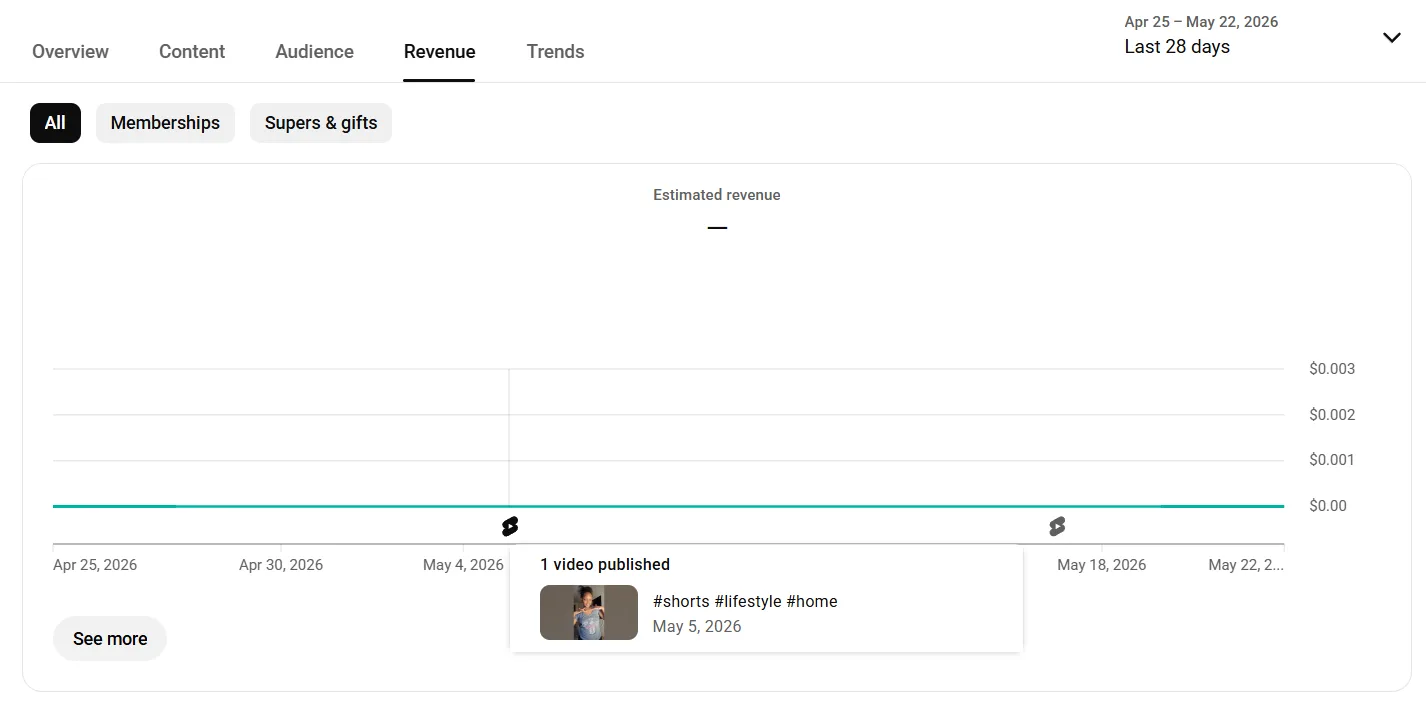
Key Metrics in the Revenue Tab
- Estimated revenue: Total earnings across all revenue sources for the selected period
- RPM (Revenue Per Mille): How much you earn per 1,000 video views after YouTube's 45% cut
- CPM (Cost Per Mille): How much advertisers are paying per 1,000 ad impressions before YouTube's cut
- Playback-based CPM: CPM calculated only on views where an ad was served
- Ad impressions: Total number of ads served across your videos
RPM vs CPM
RPM is always lower than CPM because YouTube takes 45% of all ad revenue before paying creators. If your CPM is $10, your RPM will be approximately $5.50. RPM is the number that reflects your actual earnings per 1,000 views and is the more useful metric for creators tracking revenue performance.
How to Use Revenue Tab Data to Improve Earnings
Review your top videos by estimated revenue rather than by views. A video with 50,000 views generating more revenue than a video with 80,000 views is attracting higher-paying advertisers. That gap tells you which topics and audience segments command higher CPM rates in your niche.
Cross-reference your revenue data with your traffic sources. Videos pulling strong search traffic from high-intent keywords consistently generate higher RPM than videos pulling browse or suggested traffic because search viewers signal stronger purchase intent to advertisers.
5. The Trends Tab
The Trends tab shows you what your audience and viewers across YouTube are actively searching for right now. It is the only tab in YouTube Studio built entirely around content discovery rather than performance review, making it the most useful starting point for planning your next video before you open any keyword research tool.
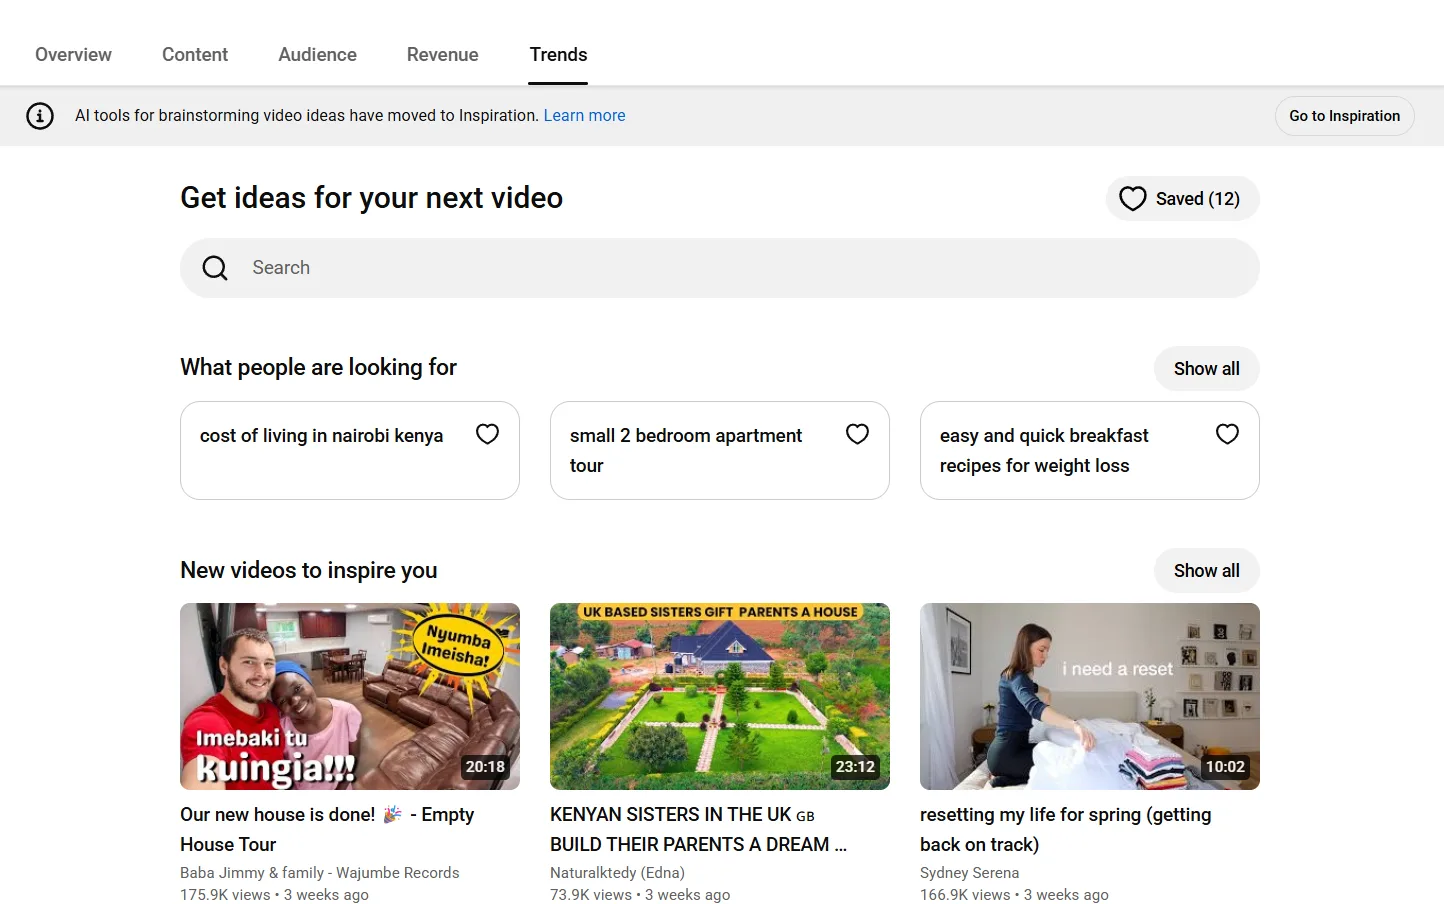
What the Trends tab shows:
- Top searches: The most common search terms from your specific audience over the last 28 days. These are not platform-wide searches. They are searches from the viewers already watching your channel, which makes them higher-confidence content opportunities than generic keyword data.
- Saved search terms: Any topic you have saved for future reference appears here for quick access during content planning sessions.
- Content from similar channels: Well-performing videos from channels similar to yours surface here as inspiration. This gives you a real-time view of what is gaining traction in your niche without manually searching competitor channels.
How to access the Trends tab:
- Sign in to YouTube Studio at studio.youtube.com
- Click Analytics in the left navigation menu
- Click the Trends tab at the top of the Analytics page
- Enter a search topic in the search bar or browse the trending page
- Click Save next to any search term you want to track over time
How to Use the Trends Tab for Content Planning
The top searches card is the most actionable section. A search term appearing here means your existing audience is actively looking for that content and not finding it on your channel. That gap is your next video. Type any topic into the search bar to see how much interest it is generating among your audience specifically before committing to filming it.
Note: Some insights in the Trends tab are limited by country, language, and device. If your audience is geographically diverse, results may reflect the largest geographic segment of your viewers rather than your full audience picture.
How to Read the Audience Retention Graph
The five tabs above give you the channel-level picture. The single most important video-level report sits one click deeper: open any individual video, then open its Engagement tab, and you reach the audience retention graph.
It is the closest thing YouTube gives you to watching a viewer's finger hover over the back button second by second, and it explains more about why a video did or did not take off than any other chart in Studio.
Two numbers sit above the curve, and they are the ones to internalize first:
- Average view duration (AVD): the average time a viewer spends watching before they leave, shown as minutes and seconds. It is the raw attention number, and alongside CTR it is one of the two metrics with the most direct pull on how widely the algorithm distributes a video.
- Average percentage viewed: AVD expressed as a share of the video's length. A ten-minute video with a four-minute AVD has an average percentage viewed of 40%. This is the fairer comparison across videos of different lengths, and it is the retention figure most creators mean when they talk about their retention.
The graph itself plots what percentage of viewers are still watching at every moment of the video. It almost always starts near 100% and falls from there. Your job is reading the shape of the fall, not the starting point.
The Intro Drop: Your First 30 Seconds
Every retention curve drops fastest in the opening seconds, because that is the moment viewers decide whether the video delivers what the thumbnail promised. A steep cliff in the first 30 seconds is the most common and most fixable retention problem on the platform.
If you lose 30% or more of viewers before the 30-second mark, the packaging set an expectation the intro did not immediately pay off. Cut the throat-clearing, open on the payoff or the question the video answers, and earn the slower build later once attention is locked in.
Dips: Where Viewers Leave
A sudden drop partway through the curve marks a moment viewers chose to leave. Hover over the dip to read the timestamp, then watch your own video from 30 seconds before that point. The cause is usually one of three things: a slow tangent, a promise the video set up but did not deliver, or a natural stopping point such as a verbal summary that signals the value is over.
Note the pattern and tighten or cut that beat in your next edit. A single recurring dip fixed across future uploads compounds into real watch-time gains over a year of publishing.
Spikes: Moments Worth Repeating
An upward bump means the curve briefly rose above its own trend, which only happens when viewers rewind to rewatch a moment, or when a clip gets shared and sends new viewers straight to that timestamp. Spikes are gold.
They tell you exactly which demonstration, reveal, or line landed hard enough that people wanted it twice. Study what you did there and build more of it into future videos, because it is a repeatable formula your audience has already voted for.
Absolute vs Relative Retention
YouTube offers two views of the same data. Absolute retention is your own curve in isolation. Relative retention compares your video against all YouTube videos of similar length, so you can see whether your intro and pacing hold attention better or worse than the platform norm.
Use absolute retention to find your specific dips and spikes, and use relative retention to judge whether your numbers are genuinely strong or just average for the format. The key moments markers on the graph flag the biggest spikes and drops automatically, so you can jump straight to the parts worth studying.
Shorts Analytics: Viewed vs Swiped Away
Shorts do not play by long-form rules, and their most important metric does not appear anywhere in the standard reports. To find it, open the Content tab, click the Shorts chip at the top, and look for Viewed vs Swiped away.
This single ratio decides a Short's fate. Out of everyone the feed showed your Short to, it measures how many stayed to watch versus how many flicked past it in the first instant. It is the Shorts equivalent of click-through rate, except you cannot fix it with a thumbnail. The opening frame and the first second are the entire pitch, so that is where the work goes.
| Swiped-Away Rate | What It Means |
|---|---|
| 10% to 30% | Healthy. Your opening frame is earning the watch. |
| 30% to 40% | Watch closely. The hook is soft or the audience match is loose. |
| Above 40% | Red flag. The first frame is not compelling or you are reaching the wrong viewers. |
Two more Shorts numbers matter alongside it:
- Shorts retention: aim to hold above 80% through the first three seconds, the swipe-or-stay moment, and finish with an average percentage viewed above 70%. Shorts standards run far higher than long-form because the format is built to loop, and a strong loop multiplies watch time on every play.
- Likes, comments, and shares in the first hours: early engagement velocity tells the feed whether to keep widening distribution, so a Short that sparks comments out of the gate tends to keep getting served.
What Counts as Good? 2026 Benchmarks
"Is my CTR good?" has no answer without context, but creators ask it constantly, so here are the ranges that hold across most niches in 2026. Treat them as a compass, not a scoreboard. A 4% CTR paired with strong retention beats an 8% CTR that collapses after the intro, because YouTube weighs the whole picture rather than any single number.
| Metric | Needs work | Solid | Strong |
|---|---|---|---|
| Impressions CTR | Below 4% | 4% to 7% | 7% to 10%+ |
| Average percentage viewed (long-form) | Below 35% | 40% to 55% | 55%+ |
| Intro retention (first 30 seconds) | Below 70% remaining | 70% to 85% | 85%+ |
| Shorts swiped-away rate | Above 40% | 30% to 40% | Below 30% |
Three caveats keep these honest. Longer videos naturally show a lower average percentage viewed than short ones, so judge a 20-minute video against other long videos, not against a 4-minute one. Search traffic usually retains better than browse or suggested traffic, because search viewers arrived with intent.
And a brand-new channel sits below these ranges while the algorithm is still learning who to show you to, which is normal and not a verdict. For the full breakdown of click-through rate specifically, the dedicated guide on what counts as a good YouTube CTR goes deeper than the row above.
Engagement, End Screens, and Advanced Mode
Retention tells you whether people watched. The engagement metrics tell you whether they cared, and they sit in the same video-level Engagement tab.
- Likes, comments, and shares are the clearest signal of how strongly a video connected. Shares matter most of the three, because a share pulls a brand-new viewer onto the platform on your behalf. Sort your videos by comment count and read the recurring questions: they are a direct editorial brief for your next round of videos.
- End screen and card click-through shows whether viewers act on your in-video prompts. A low end-screen CTR usually means the screen appears too late, lingers too briefly, or asks for the wrong next step. Point it at the one video you most want watched next rather than a wall of options.
- Subscribers gained per video tells you which topics convert watchers into followers. A video that pulls big views but few subscribers is reaching people who liked one thing, not your channel, which is useful context before you build a whole series around it.
Once the basics are second nature, Advanced mode (the button in the top right of any report) is where the real comparison work happens. You can put two videos side by side to see which intro held better, compare this month against last to isolate what changed, and build groups of videos, by format, series, or topic, so you measure a content type as a whole instead of one upload at a time.
Comparing a tutorial group against a vlog group often reveals which format your channel should lean into long before any single video makes the case.
How to See Another Channel's YouTube Analytics
One of the most common questions creators ask is whether they can open another channel's analytics the way they open their own. The honest answer is no, not the private data. The full Studio dashboard, with its exact CTR, retention curves, and revenue figures, is only visible to the person who owns the channel. What you can see is the public performance layer, and for competitor research that layer is usually enough.
Every public channel exposes a surprising amount through its channel page and individual video pages:
- Subscriber count and total channel views from the About tab
- Per-video view counts on every public upload, which let you spot the videos outperforming the channel's own average
- Upload frequency and posting cadence from the dates on recent videos
- Title, thumbnail, and tag patterns that reveal how a competitor packages content for search and browse
Reading this for one channel by hand is quick. Doing it across ten competitors, every week, is not. That is the gap a dedicated tool closes. Competitor Analysis tracks rival channels and surfaces their winning title patterns, posting times, and the specific videos breaking out above their baseline, so you benchmark against real numbers instead of guessing.
For a fast one-off look at a single channel, the free channel stats checker returns its public subscriber, view, and upload data in seconds.
There is also a native shortcut hiding in your own dashboard. The Other channels your audience watches card in the Audience tab, covered above, is effectively a competitor list YouTube built for you out of your viewers' real behavior. Start there, then run the channels it names through the tools above.
Exporting and Sharing Analytics Reports
If you manage a channel for a client or want to track performance outside Studio, most analytics reports can be exported. Open any report, look for the download icon in the top right, and pull the data out as a CSV or Google Sheet. YouTube does not send scheduled reports on its own, so for recurring updates you either export on a fixed schedule or feed the numbers into a reporting tool that handles it for you.
The Most Important YouTube Metrics Ranked by Impact
Most YouTube metrics explained guides treat every metric as equally important. They are not. Some metrics directly determine how the algorithm distributes your content. Others are useful for context. A few are vanity metrics that feel good to track but drive no actionable decisions.
Here is every metric that matters ranked by its direct impact on channel growth:
| Rank | Metric | Impact | What It Measures | Action When Low |
|---|---|---|---|---|
| 1 | Click-Through Rate | Very High | Whether packaging converts impressions to views | Update thumbnail and title |
| 2 | Average View Duration | Very High | Whether content holds attention after the click | Fix hook and content structure |
| 3 | Impressions | High | How widely YouTube is distributing your content | Improve keyword targeting and SEO |
| 4 | New Viewer Ratio | High | Whether channel is reaching beyond existing audience | Add search-optimized content |
| 5 | Search Traffic % | High | How much traffic comes from active search queries | Strengthen metadata and keyword research |
| 6 | Watch Time | Medium | Total viewing hours accumulated across channel | Publish consistently and improve retention |
| 7 | Subscriber Rate | Medium | How many viewers convert to subscribers per view | Improve content value and CTAs |
| 8 | RPM | Medium | Actual earnings per 1,000 views | Shift toward higher CPM content topics |
| 9 | Views | Low | Total watch sessions in a period | Symptom of other metrics, not a cause |
| 10 | Subscribers | Low | Total channel subscriber count | Vanity metric without engagement context |
The two metrics at the bottom of this table are the ones most creators check first. Views and subscriber count are outputs of the metrics above them. Fixing CTR, retention, and impressions produces more views and subscribers as a natural consequence. Chasing views and subscribers directly without addressing the metrics that drive them is the most common analytics mistake on the platform.
The three metrics every creator should check after every upload:
- CTR in the first 48 hours
- Average view duration at the 48-hour mark
- Traffic sources after seven days
Those three data points tell you whether the packaging worked, whether the content held attention, and whether the keyword targeting is generating search traffic. Every other metric provides useful context around those three core signals.
Benchmark your CTR, retention, and SEO against your nicheChannel Audit pulls every metric in this guide and compares them against the channels competing with you, then surfaces the single highest priority fix to make before your next upload. Free to try.Try Channel Audit →YouTube Search Terms Analytics: Using Data for Content Research
The search terms report inside YouTube search terms analytics is one of the most underused tools available to creators in YouTube Studio. Most creators never open it. The ones who do consistently find confirmed content opportunities sitting inside their own channel data.
How to access the search terms report:
- Open YouTube Studio and click Analytics in the left menu.
- Click the Content tab at the top of the Analytics page.
- Scroll down to the Traffic Sources card and click See More.
- Click YouTube Search in the traffic source list.
- Scroll down to see the full list of search terms driving views across your channel.
What the Search Terms Report Tells You
Every phrase in this list is a confirmed search query that real viewers typed into YouTube before finding your content. That confirmation is more valuable than any keyword research tool because it is drawn from your actual audience rather than platform-wide search data.
Three ways to use search terms data for content research:
- Find your strongest ranking keywords: The phrases driving the most views from search are the topics YouTube already associates with your channel. Publishing more videos targeting those same keyword clusters reinforces that association and improves ranking across the entire cluster.
- Identify content gaps: Search phrases appearing in your data that you have not yet built a dedicated video around are your highest confidence content opportunities. The demand is confirmed. The audience already exists. The only missing piece is a video targeting that phrase directly.
- Spot unexpected ranking opportunities: Phrases you never deliberately targeted but are appearing in your search traffic reveal topics the algorithm is already connecting to your channel. A dedicated video targeting those phrases can significantly increase traffic from an audience segment you did not know you were reaching.
Pro Tip: Export your search terms data every quarter and compare it against the previous quarter. Phrases that are growing in volume over time represent rising demand in your niche that you can act on before competitors identify the same trend.
A Simple Post-Publish Analytics Routine
Most creators either check analytics obsessively in the first hour after publishing or ignore the data entirely until a video has been live for weeks. Neither approach produces useful insights. A structured review at specific intervals gives you the data you need to act on without the noise of checking too early or too late.
Here is the complete post-publish routine covering five checkpoints:
48 Hours After Publishing: Check CTR and Real-Time Performance
Open the Reach tab and check your CTR. Below 4% in the first 48 hours means the thumbnail or title needs updating before the algorithm's test window closes. Open the Overview tab and check real-time views. A video gaining momentum in the first 48 hours should show a rising curve. A flat line in the first 48 hours signals weak initial distribution worth investigating.
7 Days After Publishing: Check Retention and Engagement
Open the Engagement tab and review the audience retention graph. Identify the timestamp where the largest drop occurs and watch the video from 30 seconds before that point. Note the pattern for your next upload's script or edit. Check average view duration against your channel benchmark. A significant drop below your typical retention rate signals a structural content issue.
14 Days After Publishing: Check Traffic Sources
Open the Reach tab and review traffic source breakdown. Identify what percentage of views came from search. Below 15% from search on a keyword-targeted video suggests the metadata needs strengthening. Check whether suggested feed traffic is contributing. Strong suggested placement on a two-week-old video signals the algorithm is still actively distributing it.
30 Days After Publishing: Check Audience Data
Open the Audience tab and review the new vs returning viewer ratio for the video. A high returning viewer ratio on a video designed to attract new audiences confirms a keyword or discoverability problem. Check whether the video generated subscribers above or below your channel average subscriber rate.
90 Days After Publishing: Check Long-Term Search Performance
Return to the search terms report in the Reach tab and identify whether the video is ranking for its target keyword. A video still generating search traffic at 90 days is a long-term asset worth updating with fresh metadata to extend its ranking life. A video with no search traffic at 90 days needs a title, description, and tag refresh before it settles permanently at low visibility.
Common Analytics Mistakes Creators Make
Understanding YouTube video analytics is only useful if you are reading the right metrics and drawing the right conclusions from them. These are the four mistakes that consistently lead creators to make the wrong content decisions.
Mistake 1: Checking Views and Ignoring Everything Else
Views are the output of CTR, retention, and impressions working together. A creator who sees low views and responds by posting more frequently without checking CTR or retention is adding volume to a broken system. The fix is to identify which of the three core metrics is underperforming before changing anything about the upload strategy.
Mistake 2: Making Content Decisions Based on One Video
A single video's performance is influenced by publish timing, thumbnail testing luck, and short-term algorithm fluctuations that have nothing to do with the content quality or topic demand. Content decisions made from one data point are unreliable. The fix is to look for patterns across at least five to ten videos before drawing conclusions about what is working in your niche.
Mistake 3: Ignoring the Search Terms Report
The search terms report in the Reach tab is the most direct source of confirmed content opportunities available in yt analytics. Creators who never open it are making keyword and topic decisions without the most relevant data available to them. Check it monthly and act on at least one confirmed gap per content planning session.
Mistake 4: Never Checking the Audience Tab
The Audience tab reveals whether the algorithm is serving your content to the right people. A channel attracting the wrong demographic, a declining new viewer ratio, or a geographic mismatch between intended and actual audience are all problems invisible without opening this tab. Check it quarterly as part of your channel audit to confirm your content is reaching the audience it was built for.
Frequently Asked Questions
How Do I Access YouTube Analytics?
Open YouTube Studio at studio.youtube.com on desktop and click Analytics in the left navigation menu. On mobile, open the YouTube Studio app and tap the Analytics icon in the bottom navigation bar. Both versions cover the same five tabs: Overview, Content, Audience, Revenue, and Trends.
How Often Does YouTube Analytics Update?
Most metrics update every 24 to 48 hours. Real-time data covering the last 48 hours updates continuously. Revenue data updates every 24 to 48 hours but carries an additional three-day delay before final figures are confirmed.
What Is the Most Important Metric in YouTube Analytics?
Click-through rate and average view duration are the two metrics with the most direct impact on how the algorithm distributes your content. CTR determines whether impressions convert to views. Average view duration determines whether YouTube continues pushing the video to a wider audience after the initial test window. Both need to be strong for a video to receive sustained distribution.
Can I See Analytics for Other YouTube Channels?
YouTube Studio only shows data for your own channel. To view YouTube analytics for other channels you need a third-party tool. Most competitor analytics tools show publicly available data including subscriber count trends, estimated views, and top performing videos. They do not show private metrics like CTR, retention, or revenue from another creator's channel.
What Are YouTube Channel Stats and Where Do I Find Them?
YouTube channel stats refer to the overall performance metrics of a channel including total views, watch time, subscriber count, and engagement rates. Your own channel stats are available in YouTube Studio under the Overview tab. Public stats for any channel are visible on the channel page itself and through third-party analytics platforms.
Data Without Action Is Just Numbers
YouTube analytics explained properly is not about understanding every metric in the dashboard. It is about knowing which three metrics to check after every upload, which tab to open when growth stalls, and which data points tell you what to change before the next video goes live.
CTR tells you whether your packaging is working. Average view duration tells you whether your content is holding attention. Traffic sources tell you whether viewers are finding you through search. Those three metrics answer the most important questions about your channel's growth before you touch anything else.
Run the post-publish routine above after every upload. Check your search terms report monthly for confirmed content opportunities. Review your Audience tab quarterly to confirm the algorithm is serving your content to the right people. That process applied consistently turns YouTube channel statistics from a passive report into an active growth system.
For a deeper level of benchmarking beyond what YouTube Studio provides, the Channel Audit in ytgrowth.io compares your CTR, retention, traffic sources, and content patterns against competing channels in your niche, giving you the context YouTube Studio alone cannot provide.